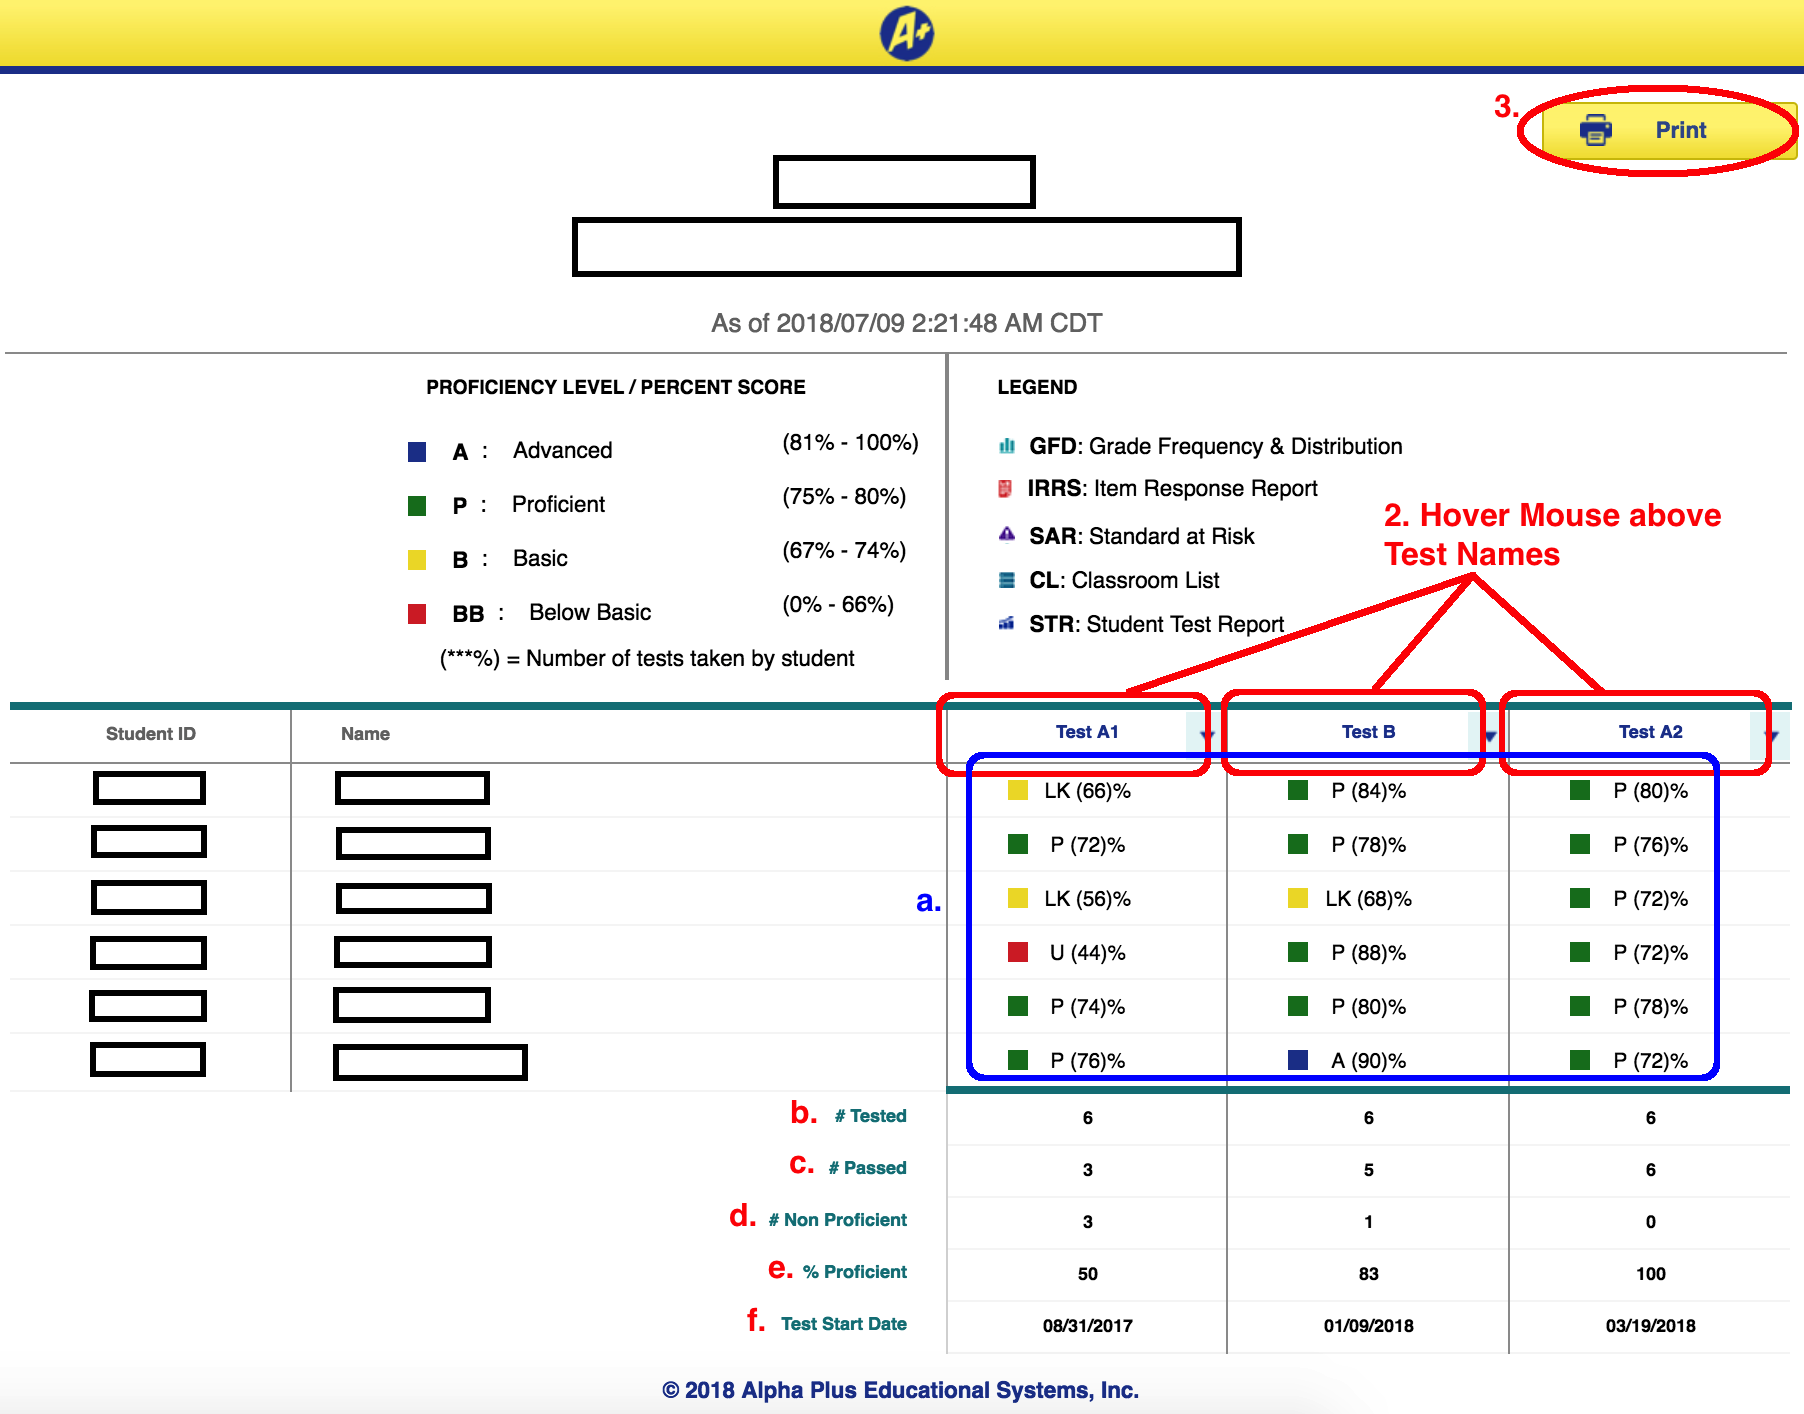
1. This Report is from Activity Tab; OR from Classroom Tab. Here you can see several pieces of information:
a) The Students' Summative Test Scores
b) Number of Students who have taken the Test
c) Number of Students who have passed the Test
d) Number of Non-Proficient Students in the Test
e) Percent of Proficient Students in the Test
f) When the Test was started.
NOTE: If the Test is enabled on Aug 7th, but the Students only log in and submit answers on Aug 15th, then Aug 15th will be displayed here.
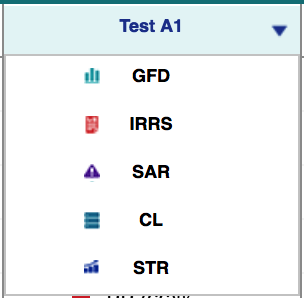
2. If you hover the mouse over any of the Test Names (Test A1, Test B, Test A2), a Dropdown Menu will appear. Click on any of the other Reports inside to view them.
3. The "Print" Button will call the default Print function of your Browser.
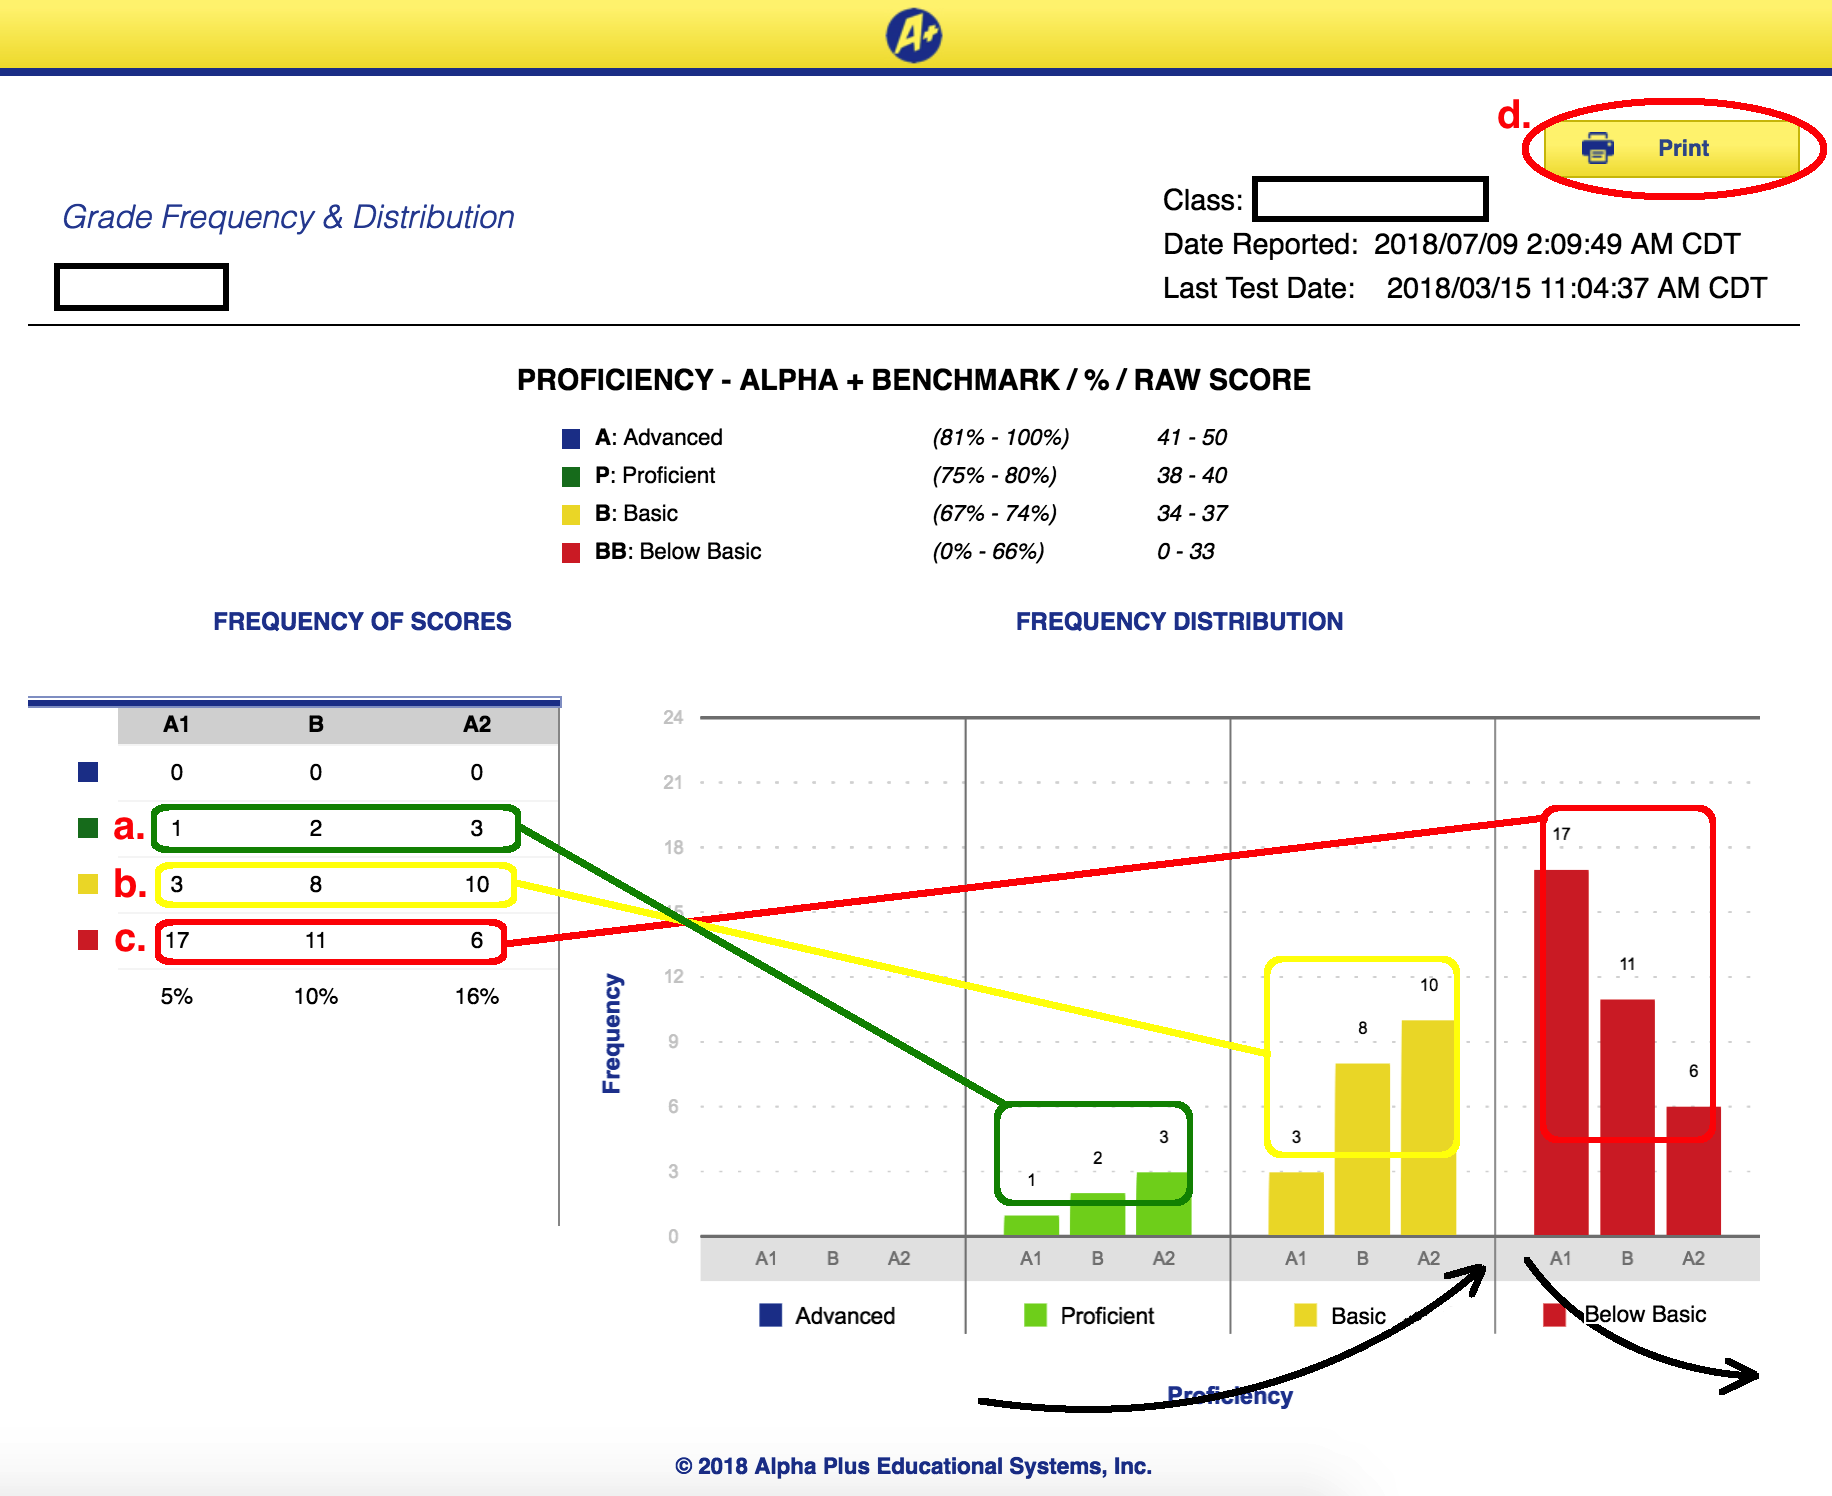
Grading Frequency & Distribution
1. This Report is from Classroom Tab > Summative Tests section; OR inside Master Report.
2. In this report, you can see the distribution of students scores, spanning from Advanced to Below Basic. Scores are broken down by Summative Test (A1, B, A2).
a) The number of Proficient Students in Summative Tests A1, B and A2. It should be the same between the Table on the left, and the Diagram on the right.
b) The number of Basic Students in Summative Tests A1, B and A2. It should be the same between the Table on the left, and the Diagram on the right.
c) The number of Below Basic Students in Summative Tests A1, B and A2. It should be the same between the Table on the left, and the Diagram on the right.
d) The "Print" Button will call the default Print function of your Browser.
3. Originally, you'll only have Data of Summative A1. If the Formative Tests are taught and remediated properly, by the end of School Year, your Advanced and Proficient Students will increase, while the Basic and Below Basic Students will decrease.
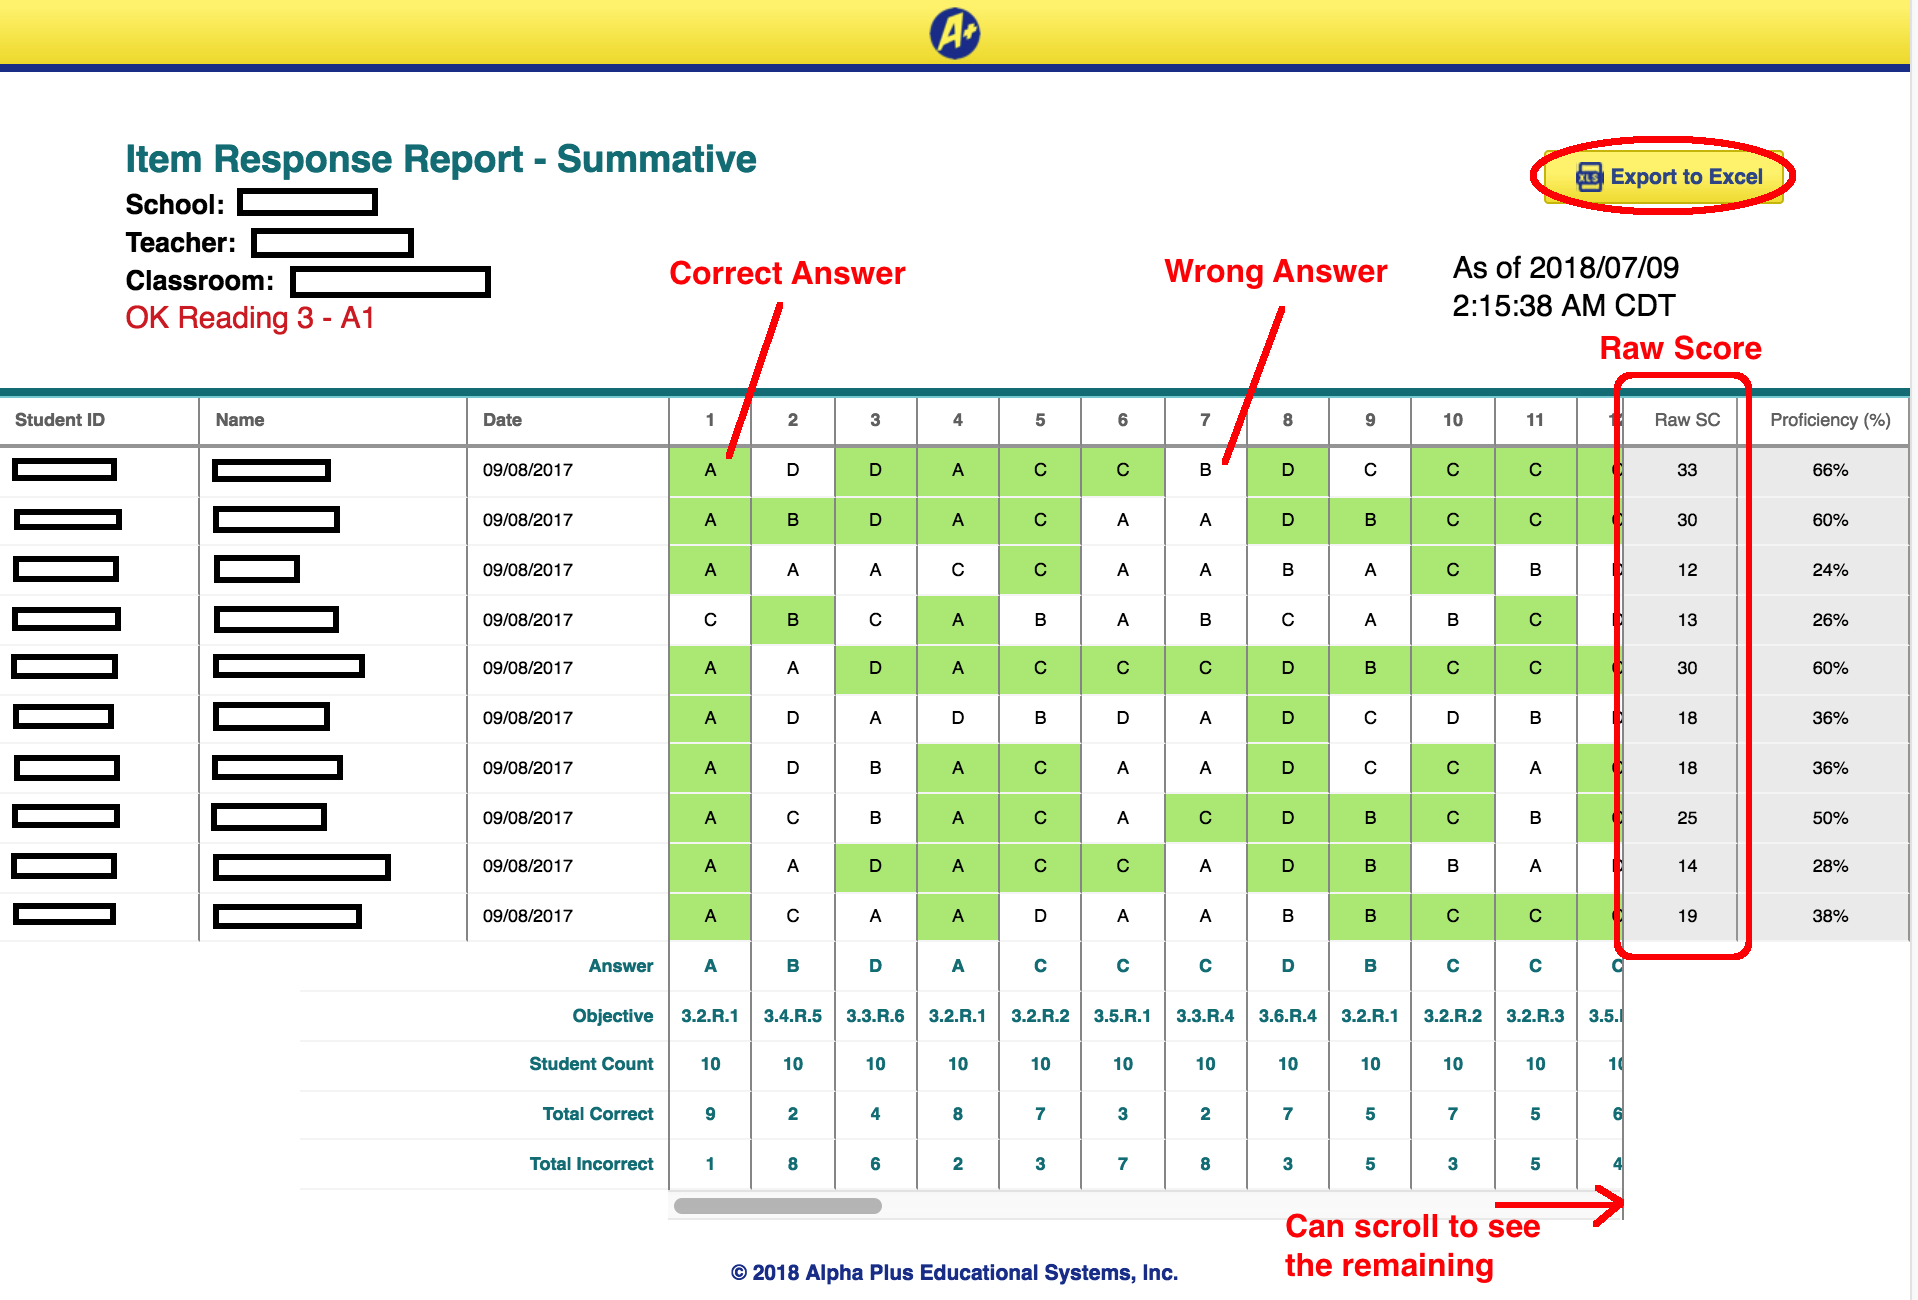
Item Response Report for Summative Test
1. This Report is from Classroom Tab > Summative Tests section; OR inside Master Report.
2. Because this Report is very wide, instead of Printing, you have the option to "Export to Excel".
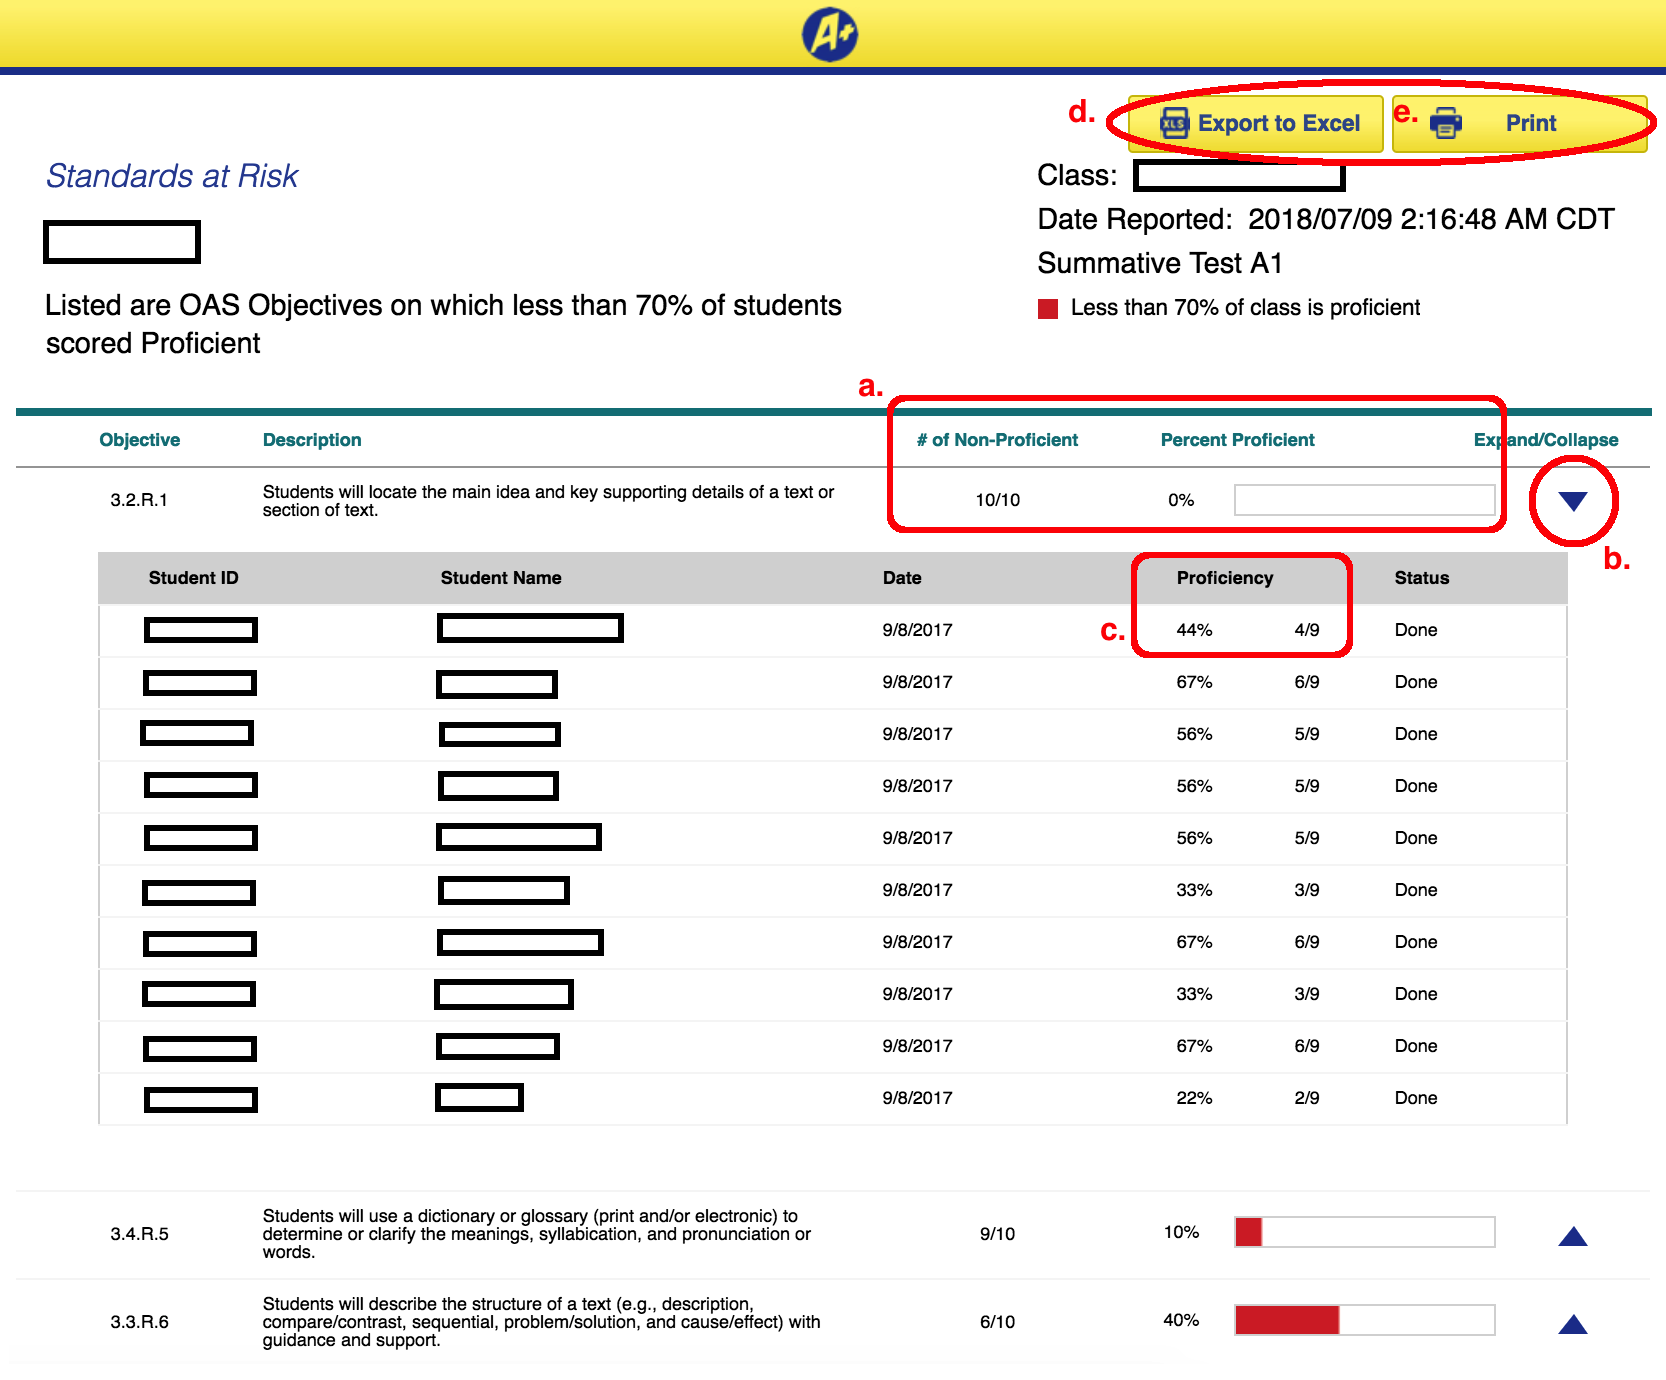
Standards at Risk
1. This Report is from Classroom Tab > Summative Tests section; OR inside Master Report.
2. This Report will show which Standards / Objectives your Classroom is currently lacking, based on the Summative Test results.
NOTE: If 70% or more of students are Proficient in a Standard / Objective, that Objective won't appear in this report.
a) Here, we have 10 Students taking the Summative Test A1. And all 10 of them are Non-Proficient. Thus, the Percent Proficient is (10 - 10) / 10 = 0%.
b) Each row of Objective can be expanded / collapsed by clicking here.
c) Upon expanding, you'll see the results of all Students inside. Here, we know that in Summative Test A1, there are 9 questions related to Objective 3.2.R.1. And this Student only answered 4 correct. Thus, his/her Proficiency is 4 / 9 = 44%.
d) You have the option to "Export to Excel".
e) The "Print" Button will call the default Print function of your Browser.
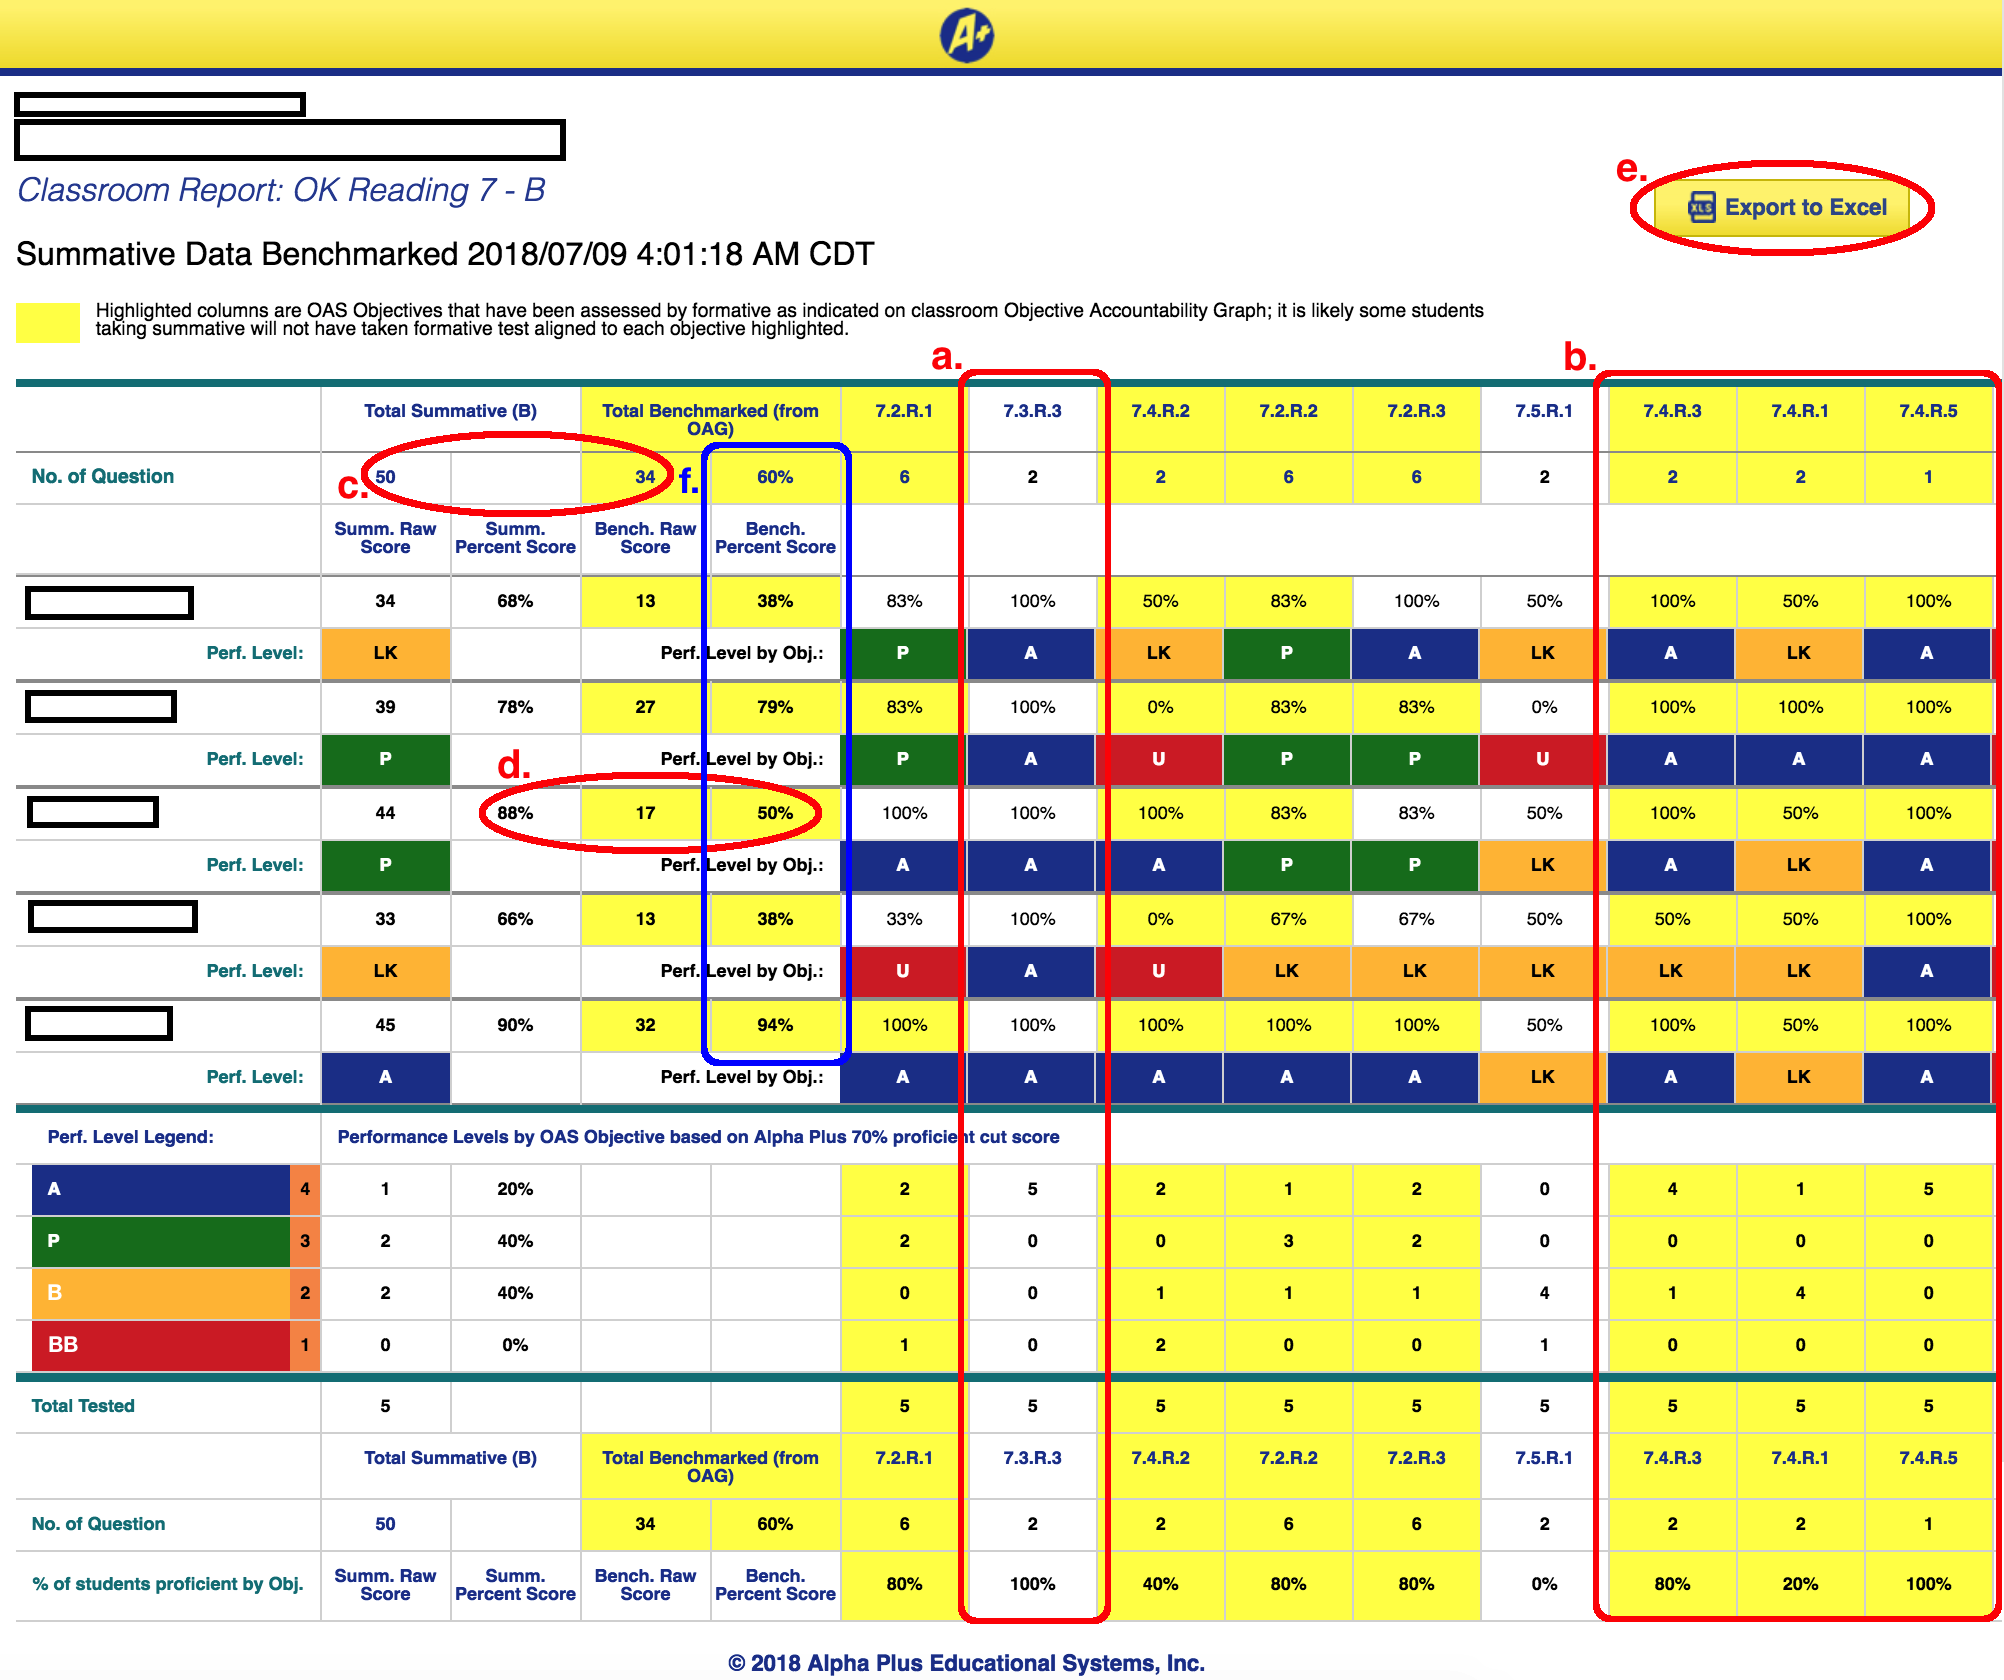
Classroom List Report
1. This Report is from Classroom Tab > Summative Tests section; OR inside Master Report.
2. This Report will show how your Classroom performs in a Summative Test, if you look at the whole Test, OR if you just look at the Objectives you've taught.
a) This Objective 7.3.R.3 is not highlighted. It means the Objective is not yet tested prior to doing Summative Test B.
b) These 3 Objectives 7.4.R.3, 7.4.R.1 and 7.4.R.5 are highlighted in Yellow. It means these Objectives were tested prior to doing Summative Test B.
c) Of the 50 questions inside Summative Test B, there are 34 questions related to Objectives that were supposedly taught and tested prior to doing Summative Test B. These 34 questions include:
- 6 questions from 7.2.R.1
- 2 questions from 7.4.R.2
- etc.
d) This Student answered 44 questions correctly. Thus (s)he scored 44 / 50 = 88% overall. But among the 34 questions mentioned above, (s)he only answered 17 questions correctly. Hence he has 17 / 34 = 50% here.
e) Because this Report is very wide, instead of Printing, you have the option to "Export to Excel".
f) Here, we have 60% as the average of all the Percentage below. (38% + 79% + 50% + 38% + 94%) / 5 = 60%.
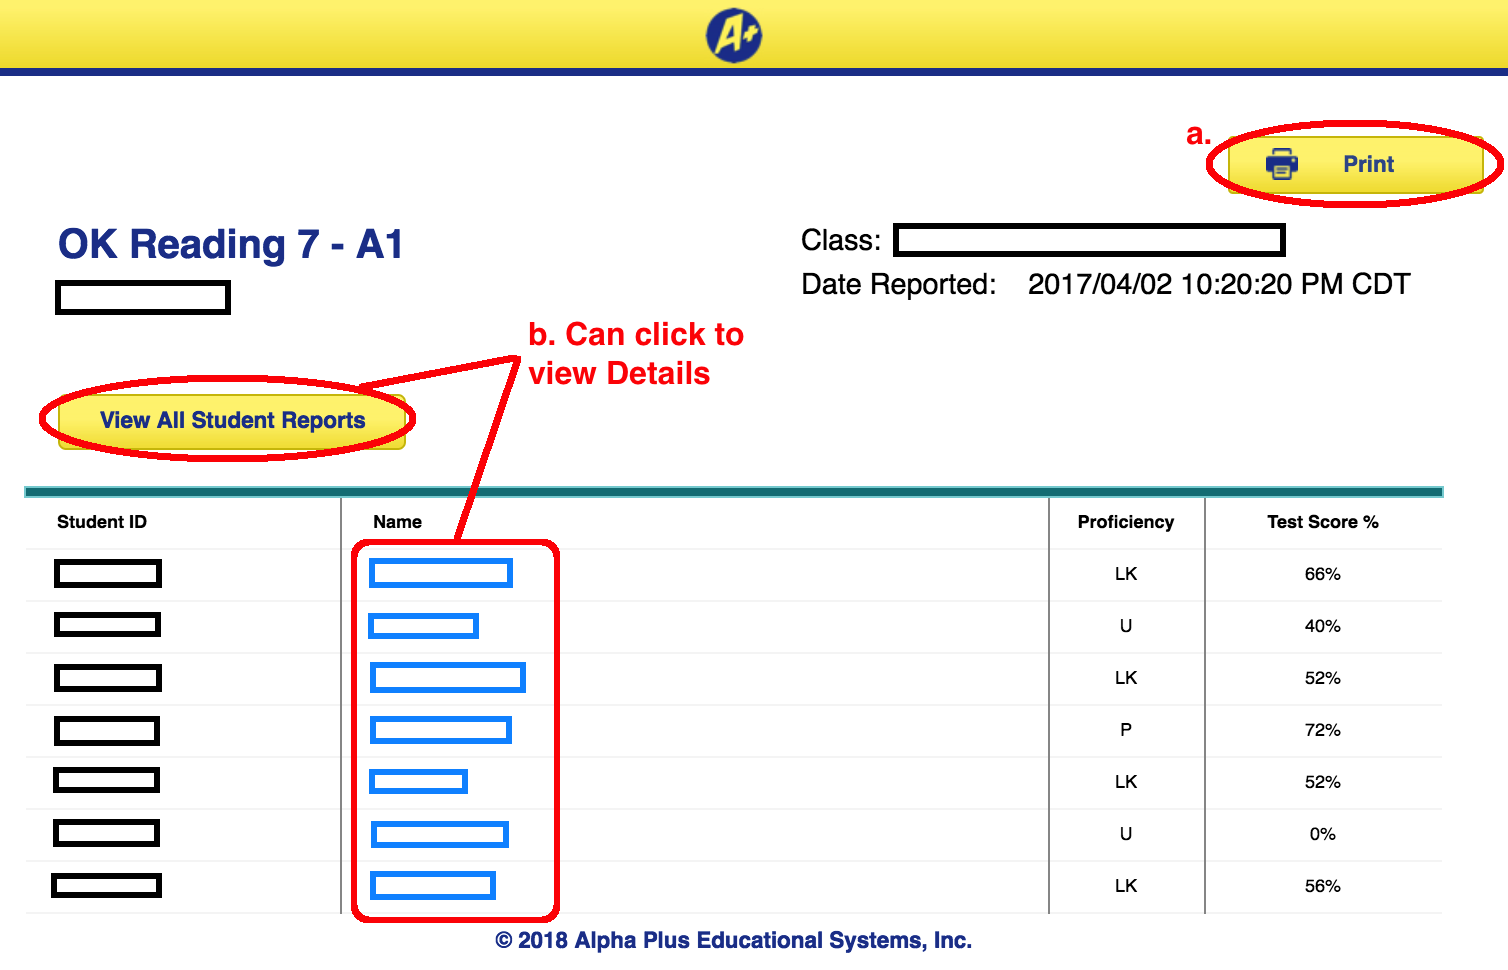
Student Test Report
1. This Report is from Classroom Tab > Summative Tests section; OR inside Master Report.
a) The "Print" Button will call the default Print function of your Browser.
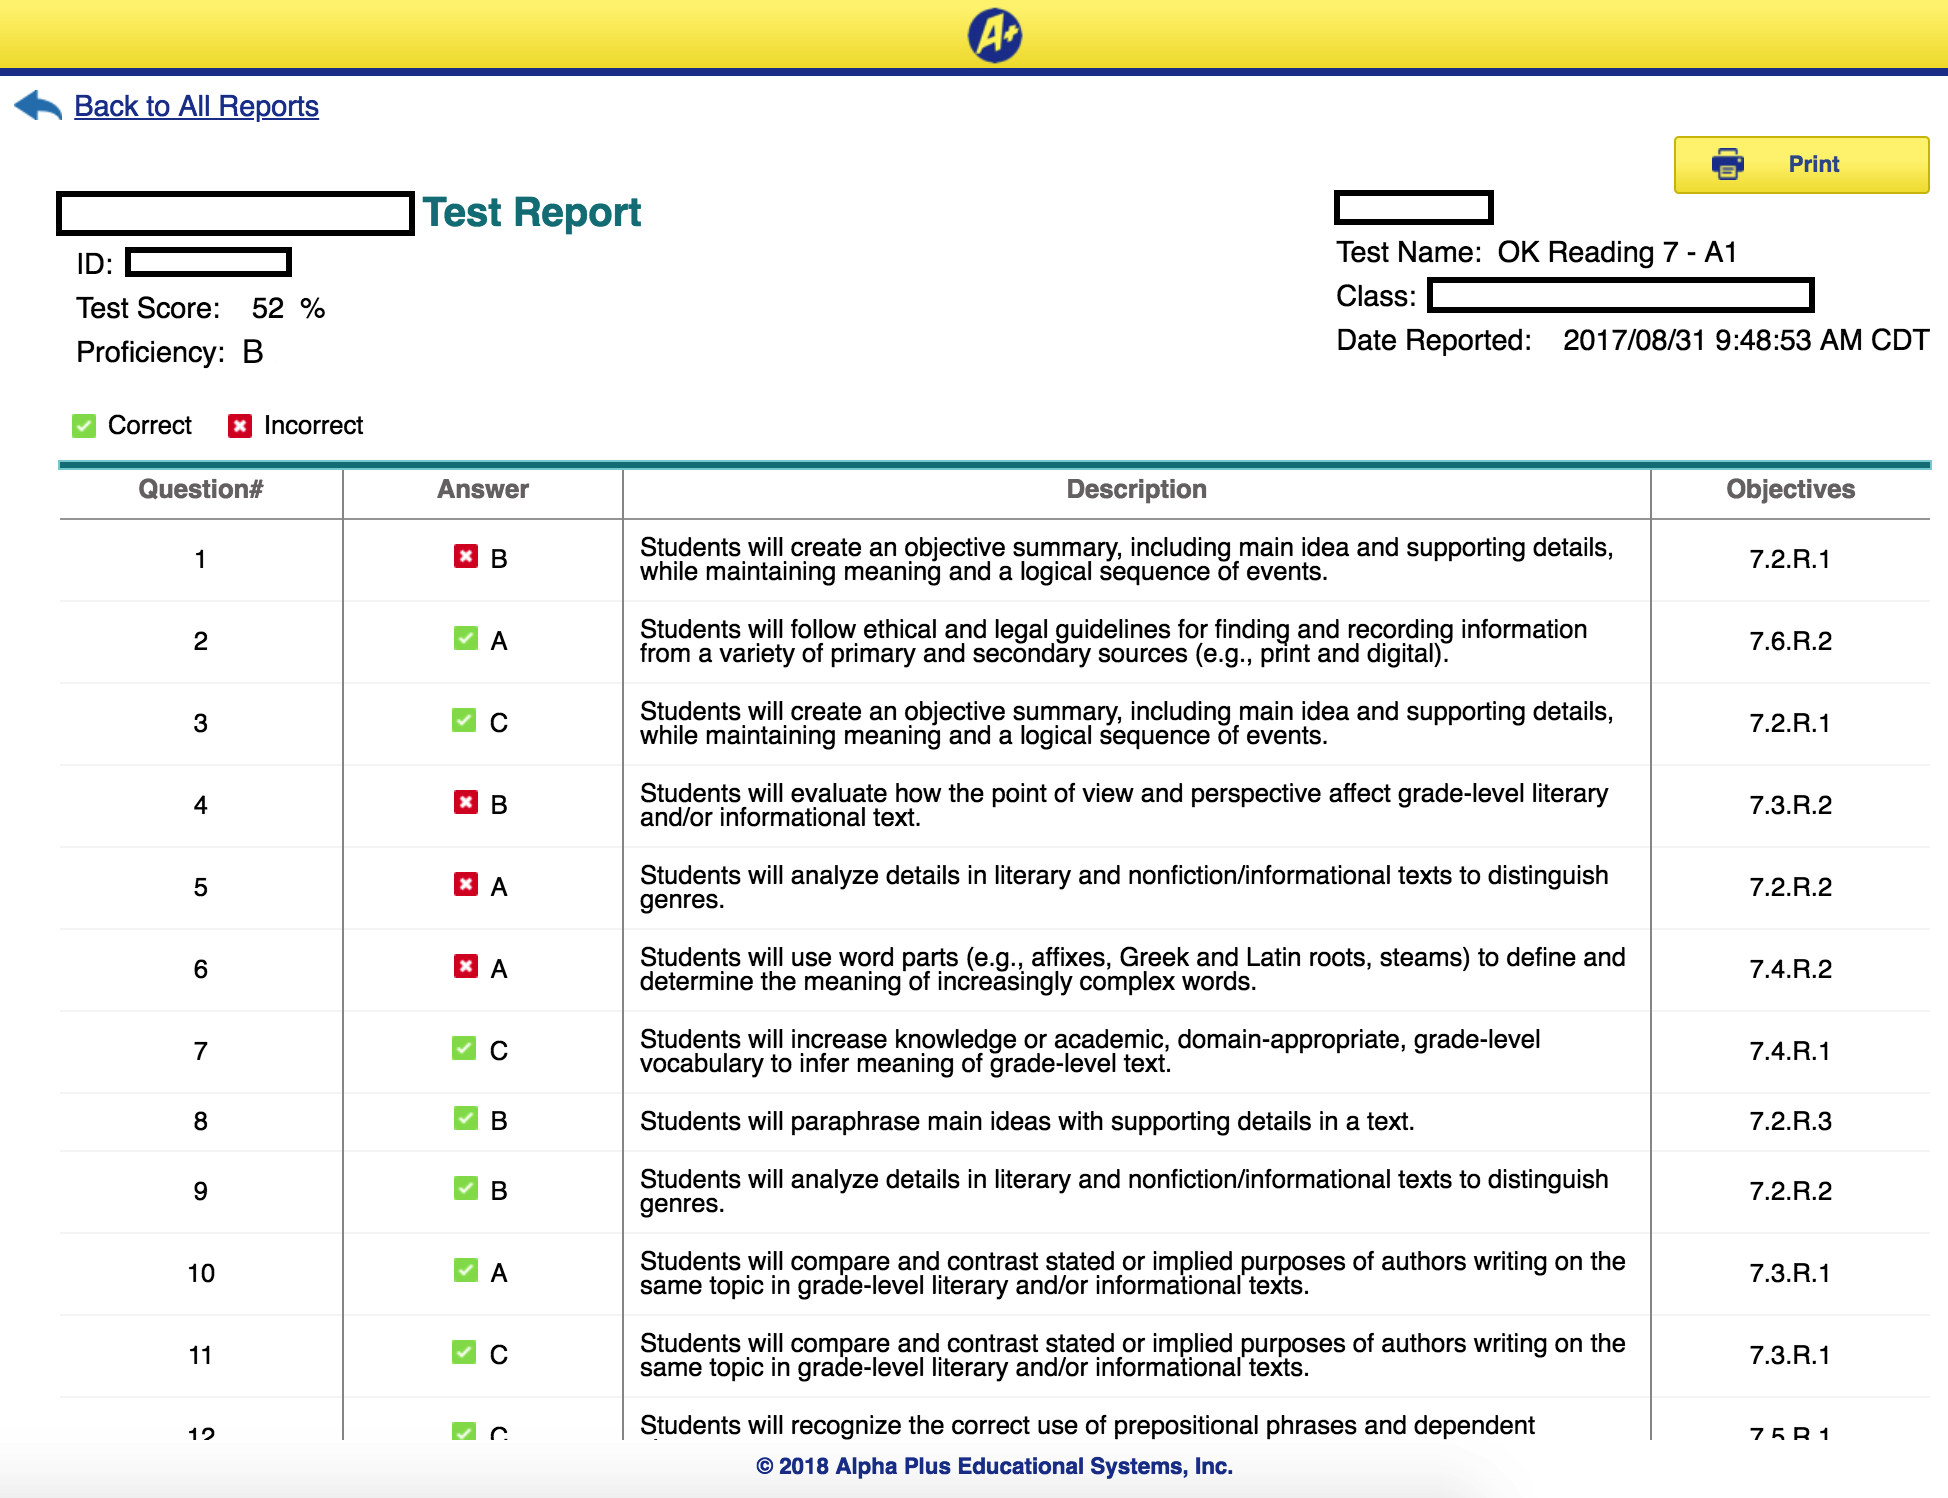
b) You can click the Student Names to view the Detailed Report of a single Student. OR you can click "View All Student Reports" Button to view all Students. The following screen will be shown:
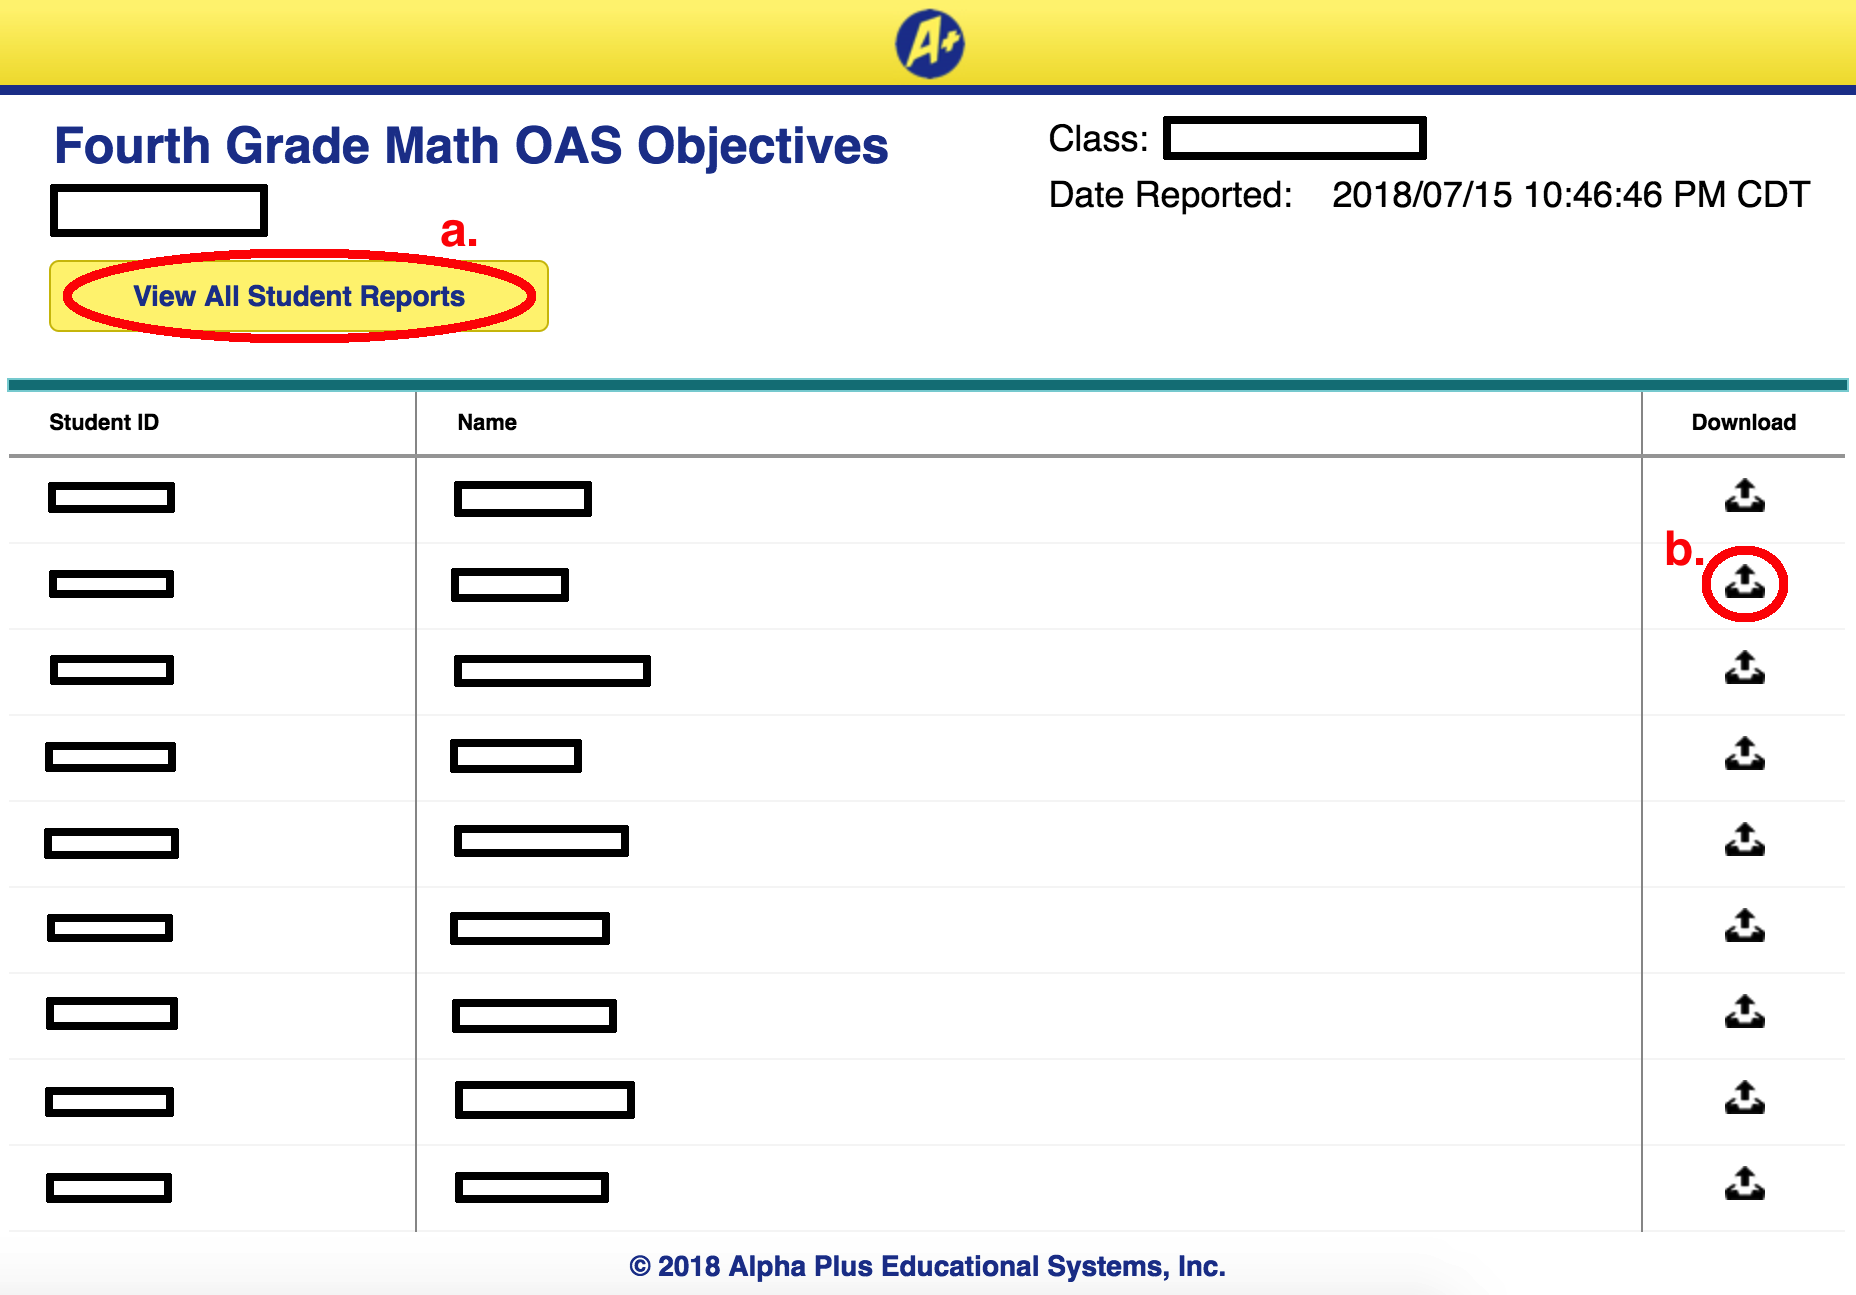
Standard Based Report
1. This Report is from Activity Tab; OR from Classroom Tab > Formative Tests section.
a)"View All Student Reports" Button: Download the Proficiency Report of all Students in the Class.
b)"Download" Button: Download the Proficiency Report of a single Student in the Class.
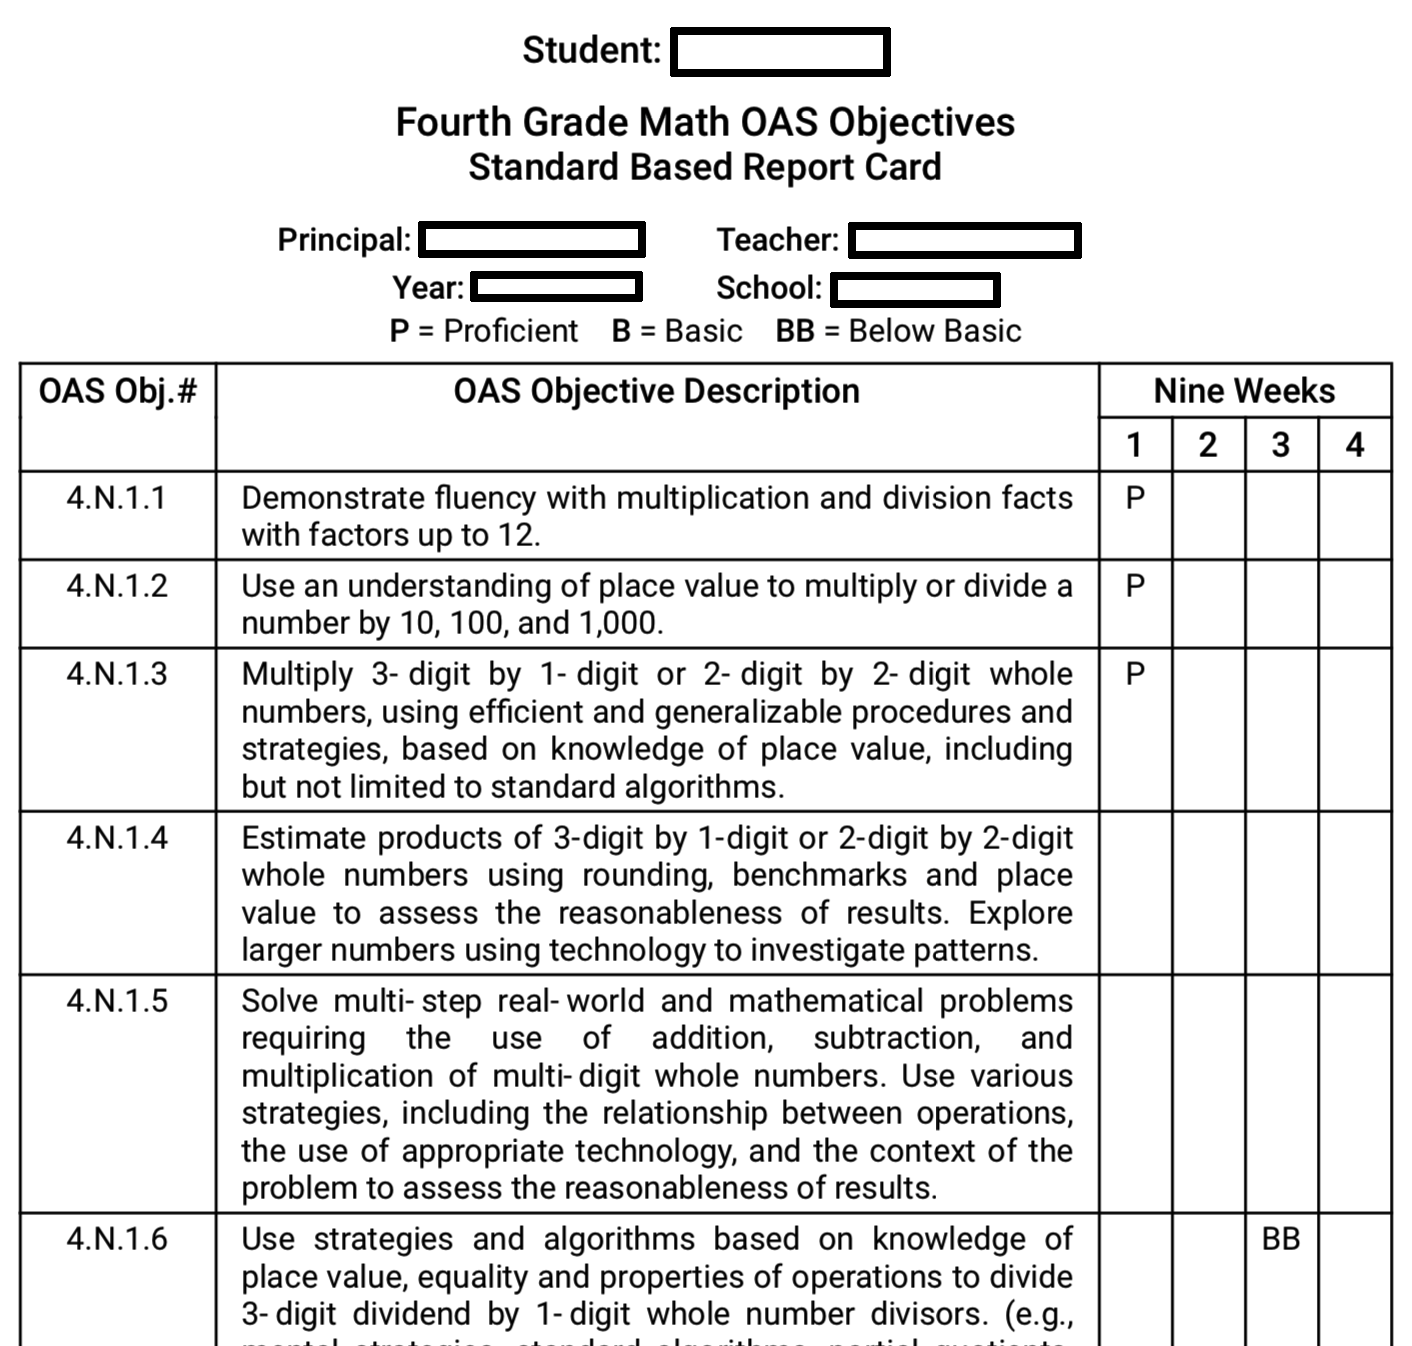
2. This Report will separate the Students' Scores into 4 Reporting Periods, called Nine-Week Periods. Every School Year, the Nine-Week Periods will change accordingly. For example, in School Year 2018-2019:
a)1st Nine-Week: From Aug 01, 2018 to Oct 19, 2018.
b)2nd Nine-Week: From Oct 20, 2018 to Dec 21, 2018.
c)3rd Nine-Week: From Dec 22, 2018 to Mar 15, 2019.
d)4th Nine-Week: From Mar 16, 2019 to May 31, 2019.
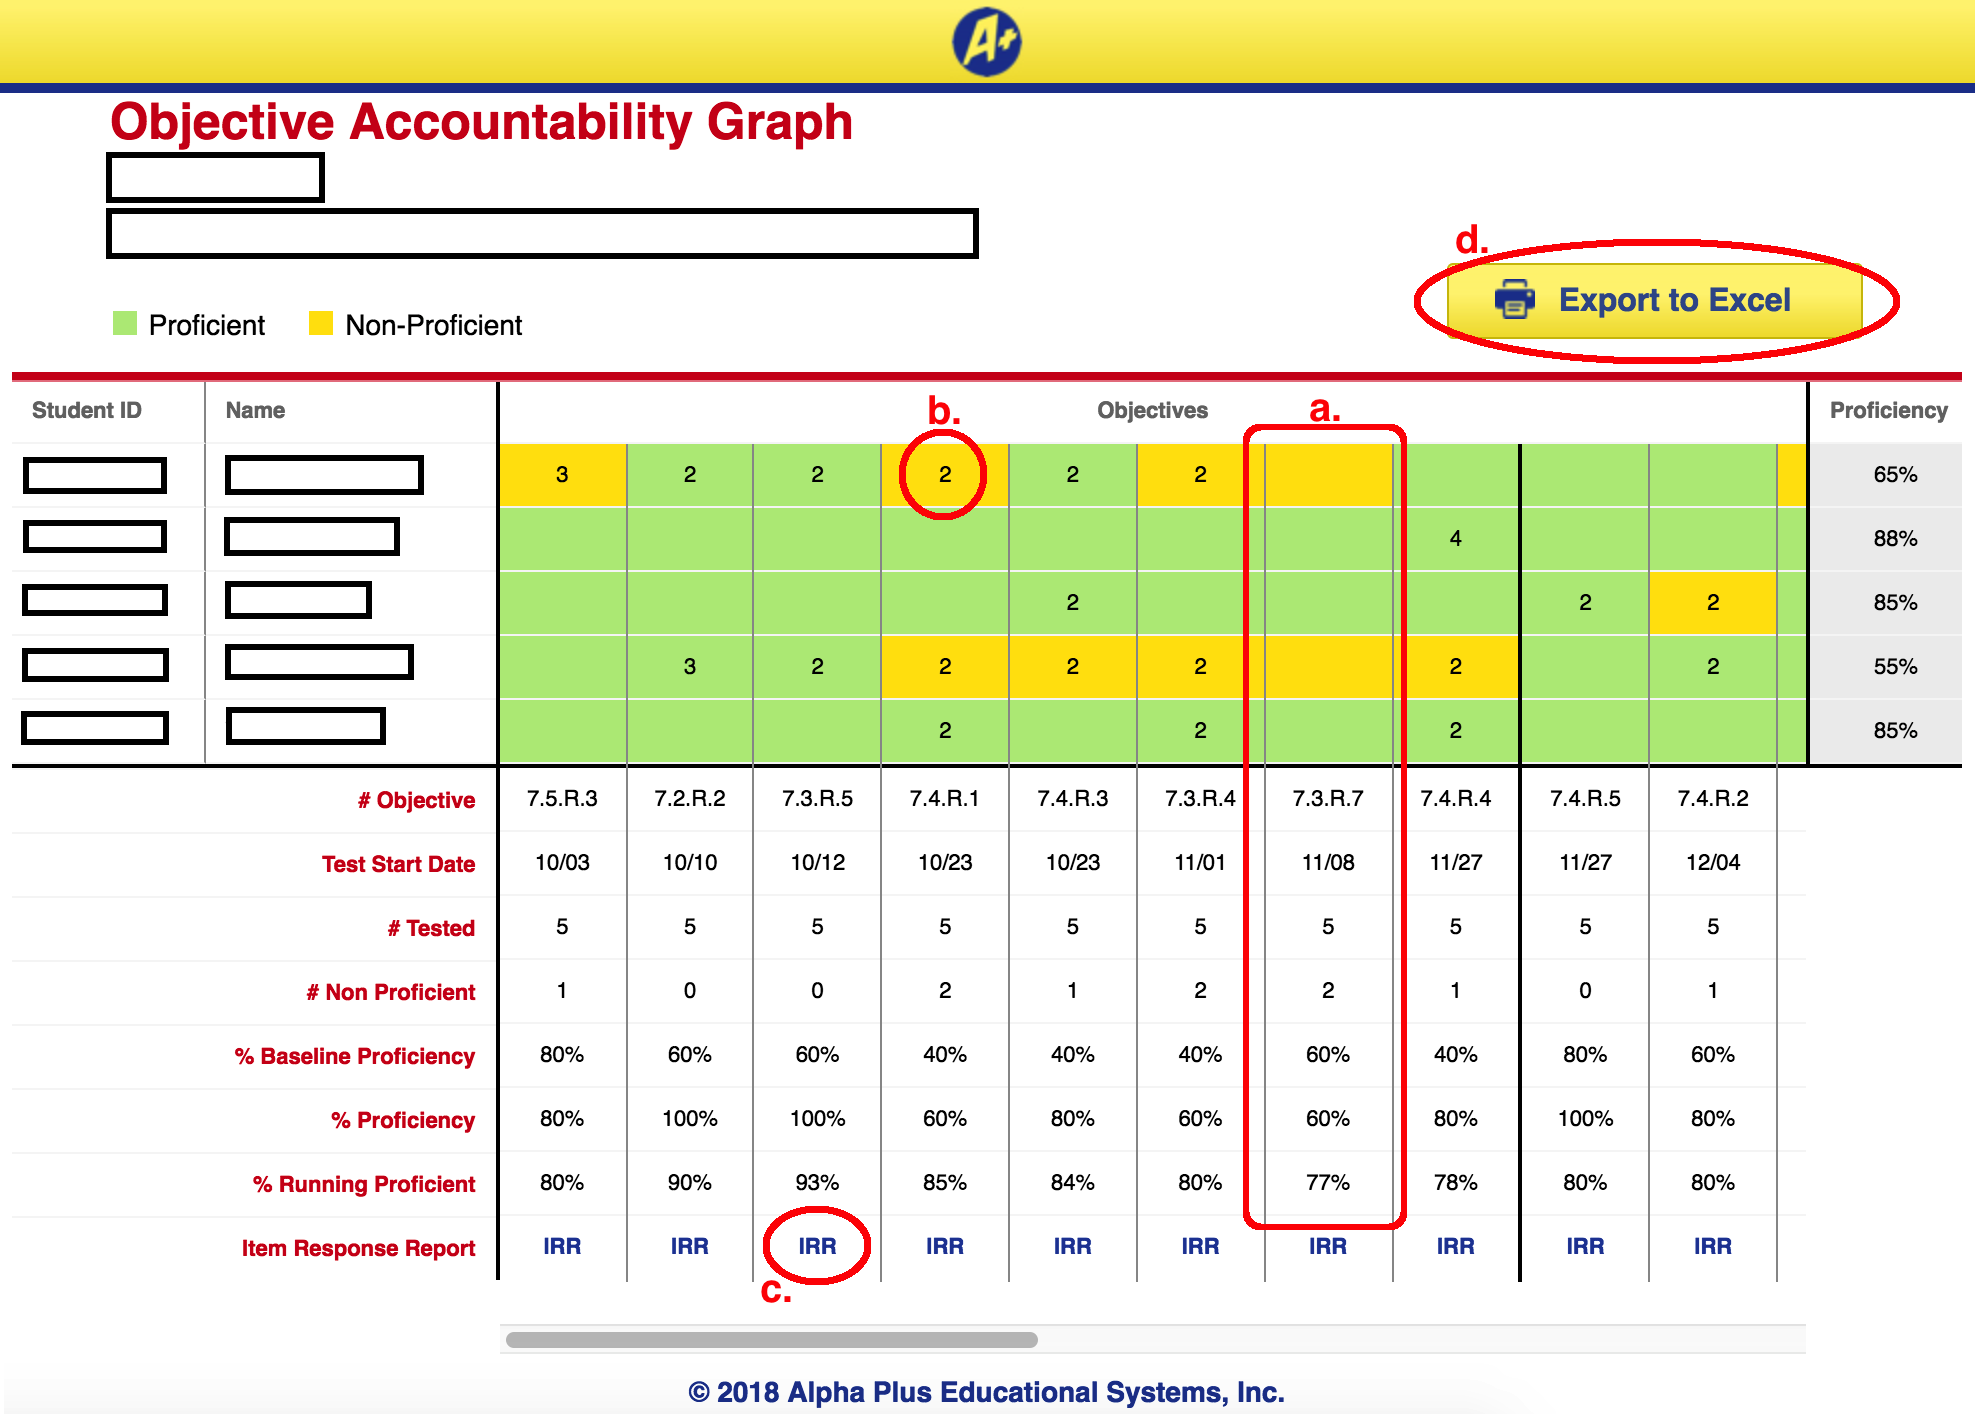
Objective Accountability Graph
1. This Report is from Activity Tab; OR from Classroom Tab > Formative Tests section.
2. Here you can see several pieces of information:
a. Each column will show the info of one Objective. Here, we know that:
- Formative Test 7.3.R.7 was first started on Nov 08.
- 5 Students have been tested. And 2 of them are Non-Proficient. You can see in the rows above, that 2 cells are highlighted in Yellow. And the remaining 3 cells are highlighted in Green.
- Baseline Proficiency is the Proficiency of only First Attempts. While the Proficiency is the Proficiency of Last Attempts. Here, they're both 60% because the Students only do 1 Attempt so far.
- Running Proficiency up to this column is 77%. From the first column up to here, we have totally 35 highlighted cells, within which are 8 Yellow cells. So we have (35 - 8) / 35 = 77%.
b. If a Student has done a Formative Test multiple times, the number of Attempts will be shown. Here, this Student has done Formative Test 7.4.R.1 for 2 times.
d) Because this Report is very wide, instead of Printing, you have the option to "Export to Excel".
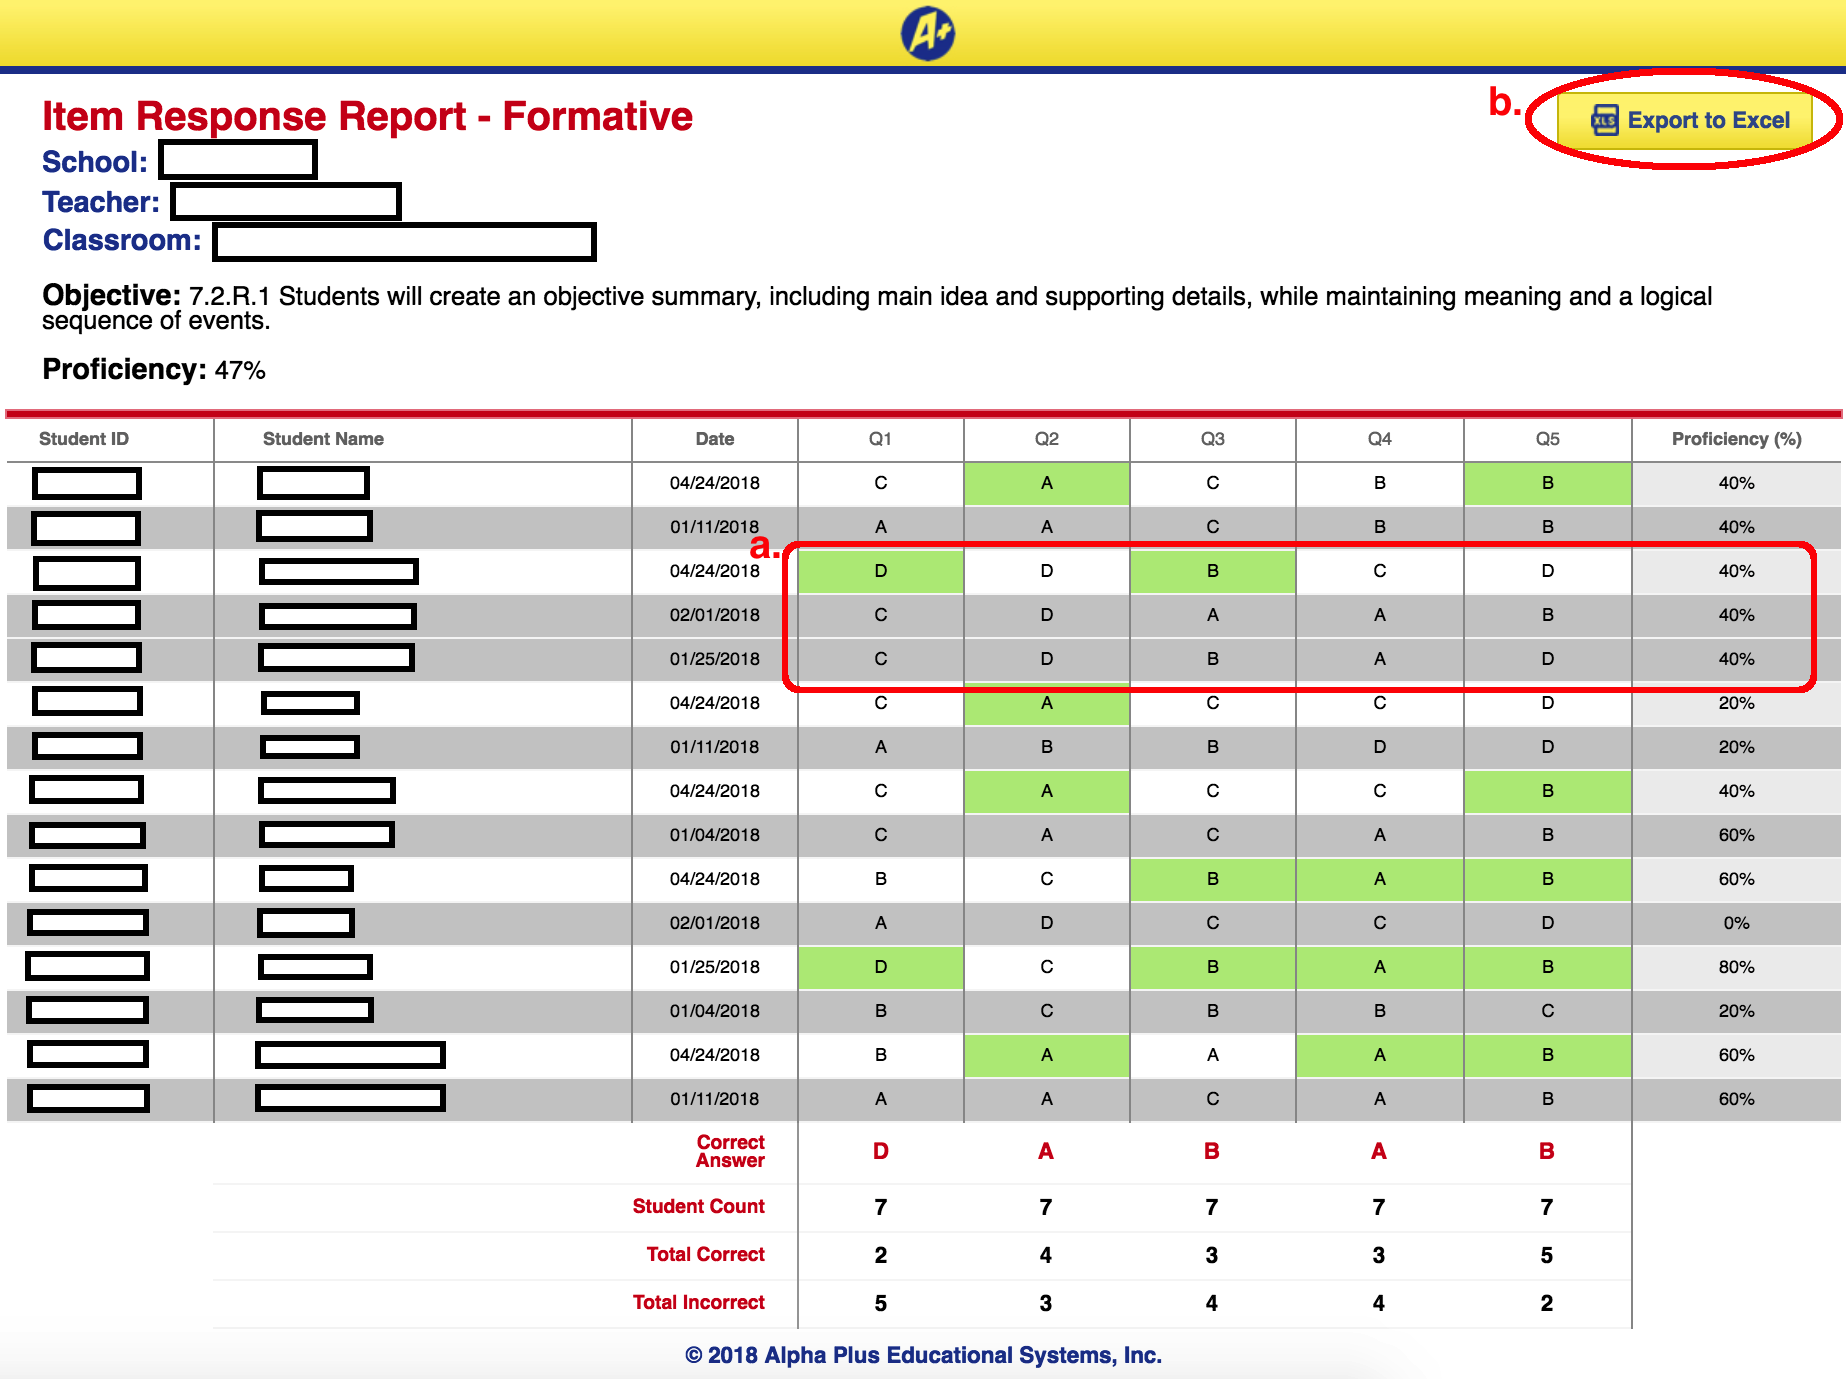
Item Response Report for Formative Test
1. This Report is from Classroom Tab > Formative Tests section; OR inside Objective Accountability Graph.
2. Here you can see several pieces of information:
a) All Test Attempts of the Student will be shown. Here, the 2 old Attempts are highlighted in Gray. The last Attempt has 2 correct answers (Q1 and Q3). Thus the final score is 40%.
b) Because this Report is very wide, instead of Printing, you have the option to "Export to Excel".
Summative Objective Analysis
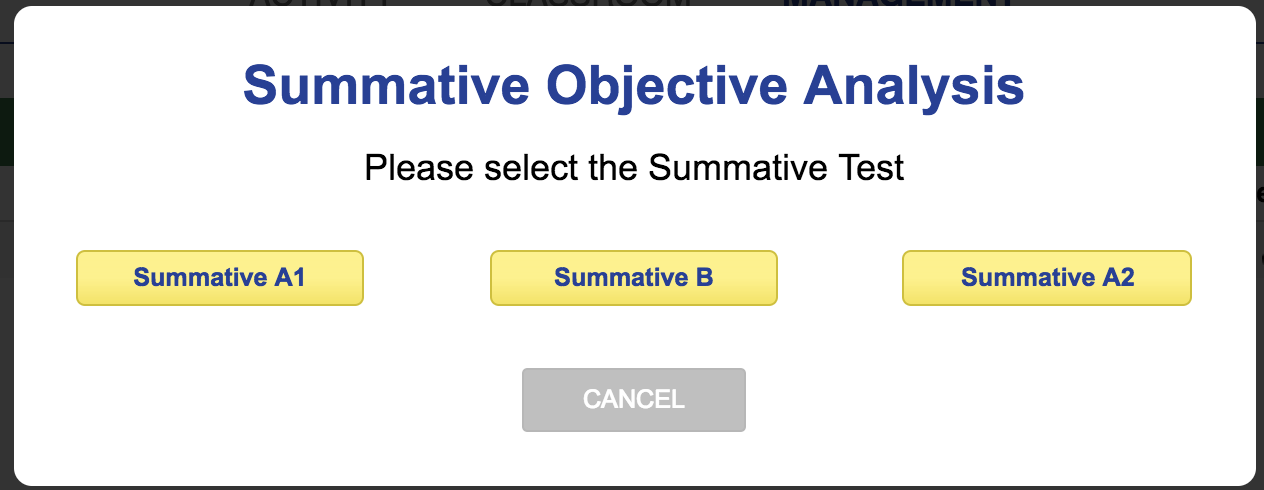
1. This Report is from Management Tab. When you see a List of Districts, or a List of Schools, you'll see this button. Click on this button to open the popup below:
2. Let's say, we want to view the Objective Analysis of Summative Test A2. So we select Summative A2 and proceed to download.
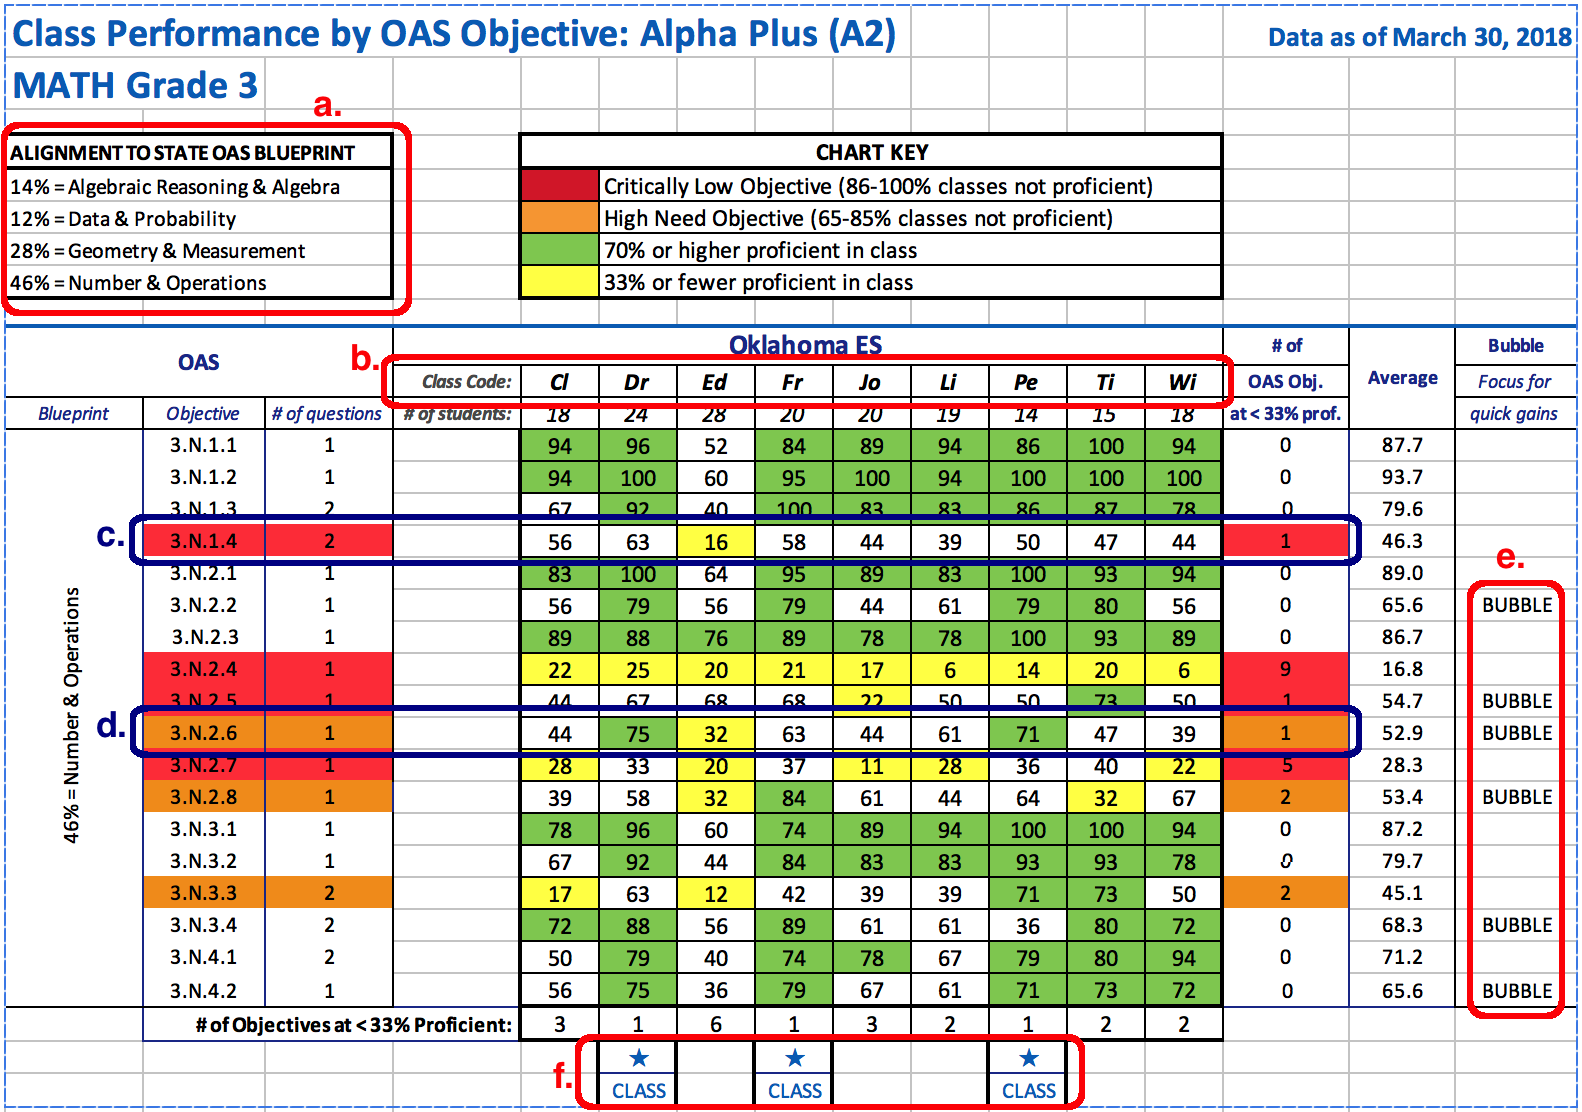
3. There will be multiple Spreadsheets inside the Excel file. Here, we look at the Spreadsheet for MATH Grade 3:
a)ALIGNMENT TO STATE OAS BLUEPRINT: This table tells us that in Math 3 Summative Test A2 that Alpha Plus provides:
- 14% of questions are related to "Algebraic Reasoning & Algebra" Objectives
- 12% of questions are related to "Data & Probability" Objectives
- 28% of questions are related to "Geometry & Measurement" Objectives
- 46% of questions are related to "Number & Operations" Objectives
- The Ratios here also suggest how much you need to focus on each Objectives, to prepare the Students for the Final Exam.
b)Class Code: This is the first 2 characters of Teacher's Last Name, and the Classroom Period. For example:
- If Classroom Name is "Cloe Math 3" => Class Code is "Cl"
- If Classroom Name is "Eddie Math 3 - 2nd Hour" => Class Code is "Ed2"
- If Classroom Name is "David Reading 4" => Class Code is "Da", BUT it'll be placed in a different Spreadsheet for READING Grade 4.
c)3.N.1.4 Objective: This row tells us that:
- Among all 9 Classes, Proficiency of Ed Class is 16%, which is < 33%. So the cell is highlighted in Yellow.
- None of the Classes has Proficiency >= 70%. So the Percentage is 9 / 9 = 100%. Thus, the whole row is highlighted in Red.
d)3.N.2.6 Objective: Let's look at another example. This row tells us that:
- 2 of the Classes has Proficiency >= 70%. They're highlighted in Green. So the Percentage is 7 / 9 = 78%. Thus, the whole row is highlighted in Orange.
e)BUBBLE: When the Average Proficiency Percentage (in previous column) is within 50% - 70%, the Objective row will be marked with BUBBLE. The Teachers may want to focus on these Objectives first, so the Students can improve and reach 70% Proficient.
f)★ CLASS: We look across Oklahoma ES, and find the Classes with the most number of Proficient Objectives. The 1st and 2nd places will be rewarded "★ CLASS" title:
- "Dr Class" only has 1 Objectives with low Proficiency (3.N.2.4 at 25%).
- "Fr Class" only has 1 Objectives with low Proficiency (3.N.2.4 at 21%).
- "Pe Class" only has 1 Objectives with low Proficiency (3.N.2.4 at 14%).
 button. Click on this button to open the popup below: